EV versus result graphs
This article illustrates situations in which the expected value can be compared with the actual result. Expected value, or EV, is here a measure of how well the players perform and the difference could be seen as the luck/unluck.
The most efficient and best illustrated way to compare results with performance are by comparing graphs for result and EV. This gives you an overview in a glance of how lucky or unlucky you have been. Luck can never be measured to 100 percent in poker, but this is the best estimation you can get (the second way to "measure luck" in poker is to analyze hand distributions).
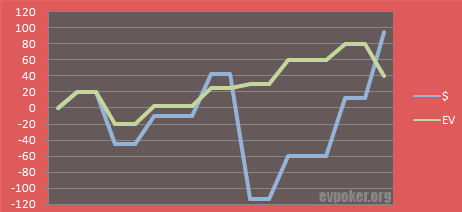
Here, you can see a diagram with one graph showing result and another showing EV:

As you can see the curves sometimes deviates from each other. In the middle of the diagram, the deviations are most apparent: the player is losing a big hand in an even situation. This could, for example, be a standard coin flip situation, like A-K against T-T. At the end of the graphs, we can conclude that the player has earned a little more money than he deserved from the sample of hands use for the diagram.
We can look at a specific hand and explain how this works. In this hand, you re-raise all-in with Q-Q and get called by A-Js. You are a favorite here with approximately 70-30%. Although, in the graph below, you will not see this in percent but money. If you and your opponent both have $50 in chips the pot will be $100. If we don't count in the rake or the chance of a split the value to be won here is $100.
Your EV in this situation is therefore 0,70*$100 = $70
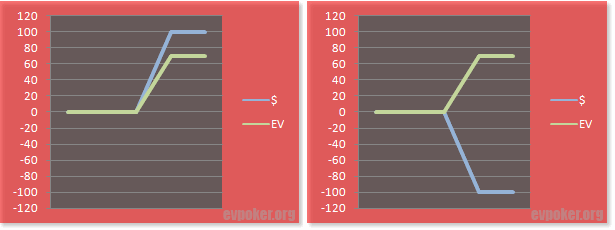
In this case we get two different graphs depending on the outcome:

In the first diagram (to the left), the favorite hand holds. However, as you can see the EV graph is some lower than the result graph. This is because the expected value was $70 and not $100. The EV is obviously meant to be seen in a long perspective.
In the second diagram the curves separates widely, and we can for sure say that you were a bit unlucky. The $70 value that you "should have" in the long run happened to be $0 in the short run.
Comparing EV with result, is a tremendous way to analyze your game and find out how well you perform in relation to how much you win or lose. Have you just been lucky or should you have won even more? One other thing is that you never must be unaware of the real circumstances. A common reaction for a player that face a lot of bad beats is beginning to mistrust the poker room for not giving them a fair game. With an EV graph you can see the fact – maybe you, in fact, were very unfortunate or maybe your losses weren't so unrealistic after all.
To get access to EV graphs you need a poker software, like Poker Tracker or Hold'em Manager. These kinds of software can automatically transform your hand history into EV graphs (on conditions that it is saved and could be exported as a.txt file) and lots of other things.
Related article:EV (expected value)
